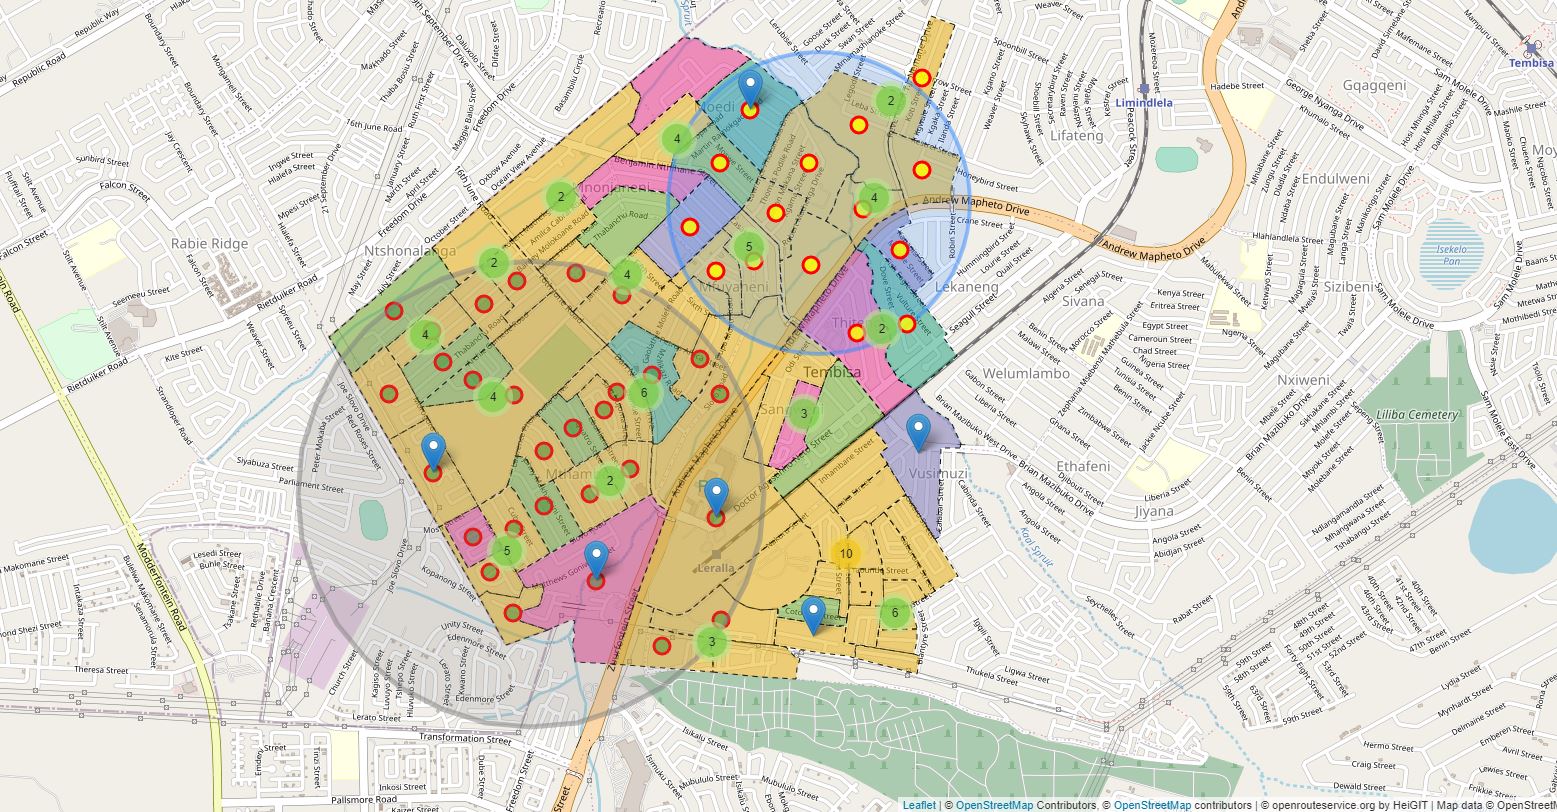

Here's What Every Business Intelligence Analyst || Data Analyst Need's to Know Everything about Thematic Maps.
What are thematic maps?
With so much information being collected in the business world today, we
must have a way to paint a picture of that data so we can interpret it in order
to get a clear idea of what the information means.
We use a thematic map which is a type of map that
portrays the geographic pattern of a particular subject matter (theme) in a
geographic area. This usually involves the use of map symbols, colors, shades
patterned in relation to a value to visualize selected
properties of geographic features to reveal hidden patterns, insight &
trends to helps us with a clear picture & a holistic understanding in order
to brings trends to life & makes insights much easier to spot.
We have different types of maps:
· Heat Maps
A heat map depicts the density of a specific phenomenon or feature over
its related location. Shading is used to indicate areas of greater or lesser
density.
· Dot density maps
Dot density maps use a large number of points, dots or polygons to show
the density of the numeric values on a map. The higher the dots in an area, the
higher the concentration of the selected value.
· Graduated and
proportional symbol maps
The dots in graduated and proportional symbol maps change in size as per
the numeric value of the element they represent.
· Choropleth or Ranges
maps
These are the most widely used and popular thematic maps. Shades,
colours and patterns are utilized to depict the distribution of statistical
data (like quantity, density, percent, value) on a map to display the
differences across geographies.
Who uses thematic maps?
Industries using spatial analysis and the ones that benefit from pattern
recognition leverage these maps. Here’s a non-exhaustive list of industries and
businesses that use thematic mapping.
This is primarily why businesses and industries need thematic maps.
Media
ROI -Improve ROI, reduce ad waste and increase footfall.
Analysis-Perform competitive analysis.
Audience-Strategies ad placement and target the right
audience.
Telecommunication
Coverage-Assess coverage and plan expansion in specific
areas.
Competitive Edge-Gain a competitive edge over other networks and
services
Proximity-Expand customer base by providing stores in ideal
proximity.
Retail
Competition-Identify competition in a particular neighborhood.
Analysis-Site and footfall analysis for new stores and
point of sales.
Expansion-Plan expansion in a new city or country
Public sector
Facilities-Improve public services based on the availability
of facilities.
Infrastructure-Optimize and monitor traffic, healthcare,
and public infrastructure.
Plans-Create crime/disaster response plans by mapping
SOS services.
Property
POI-Map dining, schools, hospital, and facilities around
new projects
Valuation-Neighborhood assessment for competition &
valuation research
Location-Enrich online selling and renting platforms with
location precision.
Market research
Service-Improve service by understanding customers’
patterns and catering to their needs and preferences.
Market-Companies learn about new opportunities, business
potential, and areas where it may be under-performing.
Target-Help them target potential customers and entice
existing ones.
Insurance
Risk-Map buildings and structures in disaster-prone
zones
Control-Insurance companies can widen their customer base,
control and minimize risks, accelerate claim procedures, and improve fraud
detection with location intelligence data.
Crime & Theft-More in-depth LI data like region-specific crime
rates related to car theft, severe weather conditions of the city or state will
provide additional information to the insurer.
Why should I use thematic maps?
Thematic maps pull in attributes or statistics about a location and
represent that data in a way that enables a greater understanding of the
relationships between locations and the discovery of spatial patterns in the
data that we are exploring.
Thematic mapping can help you tell a story. You can use a thematic map
to explore one specific data attribute. You can also map two or more attributes
to uncover more complex spatial patterns.
Other benefits:
· Better data
visualization
· Helps us with a clear
picture
· Gives a holistic
understanding
· Reveal important
insights
· Brings trends to life
· Makes insights much
easier to spot
These use cases help the analyst depict data in a clear and meaningful
way in order to convey a story to decision makers - making it easy for them to
convert trends into business strategies.
These maps are very useful when you want to analyze the spatial distribution
of your information or look for any geographic patterns and trends contained
within your data sets. They are also an excellent way to search for
correlations between data in two different locations.
When is the right time to use thematic maps?
Thematic maps convert any non-visual information about a particular
subject into an easy visual form. It focuses on the selected theme and features
only those reference points that are needed to communicate the purpose of the
map and theme effectively.
Thematic maps enable people to trace and spot geographical patterns and
trends residing under the datasets.
Thematic mapping can help you tell a story. you can use a thematic map
to explore one specific data attribute. you can also map two or more attributes
to uncover more complex spatial patterns.
These maps are used by several internal disciplines, including
operations, product development and marketing.
Where should thematic maps be used?
These maps can be used for exploratory spatial data analysis, confirming
hypotheses, synthesizing spatial data by revealing patterns and relationships,
and data presentation.
These maps can also be used to reveal hidden trends, patterns, risks and
hotspots and to identify tangible insights while simply looking at spreadsheets
and tables may not.
How will thematic maps benefit you?
Use cases of thematic maps differ from industry to industry. Within the
industries listed above earlier, these maps are also used by several internal
disciplines, including operations, product development and marketing.
We have listed some of the most common business use cases across diverse
functional areas:
- Deciding where to develop
infrastructure to support services — e.g., areas that need an ATM infrastructure
for banking self-services.
- Conduct supply-demand
analysis —
e.g., study mismatch in demand (orders, booked rides) and supply (riders,
cab drivers) to bridge the gap and reduce idle time.
- Assist profitability
analysis —
e.g., identify suburbs where carpool on-demand service is performing well,
identify locations with higher loan default rates, right areas to acquire
new users.
- Identify areas to run
geomarketing campaigns — e.g., view the areas where electric scooters are legal to
run e-scooter rental services’ ad campaigns, measure conversion rates of
your marketing activities in each geography.
- Analyse product and project
risk —
e.g., identify areas prone to calamities like landslides to gauge what
should be the insurance coverage rates.
- GeoDefence product/service’s
reach —
e.g., define delivery areas and serviceable pin codes in remote areas.
- Find the origin of a problem — e.g., flag
accident-prone freeways/roads, discover areas with high customer
drop-offs, study ride cancellation reasons in different areas.
- Analyse usage patterns — e.g., determine
which of the areas are using which of your on-demand services (grocery delivery,
food delivery, package delivery) the most.
- Keep track of the market
changes/fluctuations — e.g., verify if the drop in footfalls/orders is due to the
rise of competitors in certain areas, analyze if a store is located in the
wrong community.
By the way, did you know that you can Paint Masterpiece Visualization
Like A BI Expert Without Ever Using SQL, Scripting or Programming with EasyMaps
BI? Yep, it's true.
Go to our website, click on Claim Special now 100% Risk Free Guaranteed,
you will then be presented with a form, fill in the form and click the Submit
button for your free 30 days 100% Risk Free Guaranteed trial account to be
activated.
Thanks
#asymaps #geospatial #spatialAnalysis #locationIntelligence #gis #mapping #businessIntelligence #analytics #visualization